Scope: original public experiment. I built the application workflow and interface.
Use it to explore:
- Examine whether chart presentation supports a stated interpretation.
- Explore possible misleading axes, missing context or labels in a public sample.
- Image and claim
- Visual analysis
- Verdict
- Inspect rationale
What happens inside
A bundled image or uploaded file is sent with a claim to a vision model. A structured response contains a verdict, rationale and possible chart flags. Image size, response structure and confidence bounds are validated.
Decisions and tradeoffs
Start with a public sample
Bundled images let visitors explore the mechanism without supplying personal material.
Keep the claim beside the image
The task is consistency between visible evidence and a statement, not open-ended image description.
Qualify the confidence
The model's self-reported confidence is not a calibrated probability. Reasoning and source context matter more than the gauge.
Illustrative example
Inspect the bundled chart
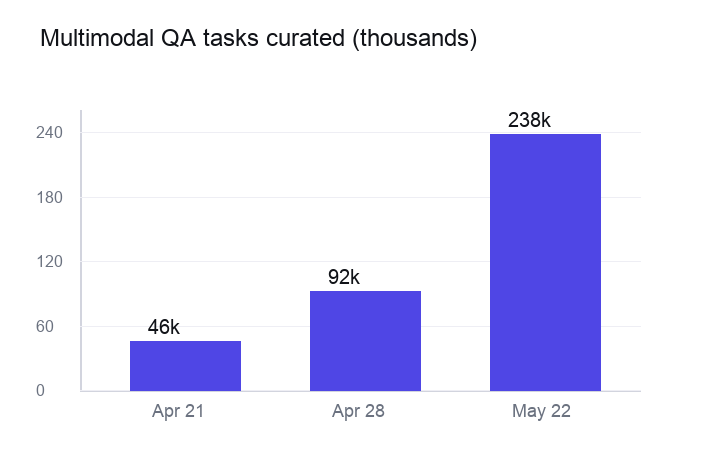
Before asking a model, inspect the axis baseline, labels and range. The image below is a bundled demonstration asset. No verdict is asserted until a live result is returned.
What this does not establish
A chart may be visually consistent but based on false data. The model can misread labels or miss context. This is not independent fact verification, and uploads are processed by external model services.
Try a live run
Live requests send your prompt and image to OpenRouter and the selected model provider. Use public, non-sensitive material. Read how demo data is handled.
Checking live availability…
Technical walkthrough reviewed September 2026. Examples do not imply client adoption or production maturity.